

LINKAGE ANALYSIS BY A TRANSMISSION /
DISEQUILIBRIUM TEST OF RUSSIAN SIBLING PAIRS
WITH CORONARY ARTERY DISEASE
Tupitsina TV1,*, Slominsky PA1, Yufereva YM2,
Perova NI2, Aronov DM2, Limborska SA1
*Corresponding Author: *Corresponding Author: Dr. Tatiana V. Tupitsina, Department of Human Molecular Genetics,
Institute of Molecular Genetics of Russian Academy of Sciences, Kurchatov sq. 2, 123182, Moscow,
Russia; Tel.: +007-499-1960210; Fax: +007-499-1960221; E-mail: tanya_tupitsina@mail.ru
page: 43
|
|
MATERIALS AND METHODS
Study Subjects. We recruited 85 Russian subjects among patients who attended the All-Russian Center for Preventive Medicine, Moscow, Russia, for CAD treatment. Inclusion required at least 50% stenosis in one or more major coronary arteries. We also analyzed 100 full siblings of these patients. Informed consent was provided by the participants before the investigations and the study was approved by the local Ethics Committee. Some clinical and biochemical characteristics of patients and their siblings are presented in Table 1.
Table 1. Clinical and biochemical data of the proband and sibling groups under study.
Assessment of Coronary Artery Disease. Computer-assisted quantitative coronary angiography was assessed using a vessel score and a stenosis score. The former was the number of coronary vessels with significant stenosis (60% or greater reduction in lumen diameter) and ranged from 0 to 3. The latter was calculated according to a modified Gensini method [37], in which the most severe stenosis in each of eight segments was assigned to grade 1 if there was 1-49% reduction in lumen diameter, grade 2 for 50-74%, grade 3 for 75-99% and grade 4 for total occlusion. The scores in all of the eight segments were added to give a total out of a theoretical maximum of 32.
Plasma Lipid and Lipoprotein Measurements. Blood samples were collected from subjects after a minimal 10- hour fast. Aliquots of plasma were frozen at 20°C before measurement of lipid, lipoprotein and apo lipoprotein levels. Total cholesterol, HDL-C and TG levels were measured using enzymatic assay kits from Roche Diagnostics (Basel, Switzerland). HDL-C was measured as the level of cholesterol that remained in the supernatant after precipitation of the apoB-containing lipoproteins with dextran sulfatemagnesium. LDL-C was calculated using the equation of Friedewald et al. [38].
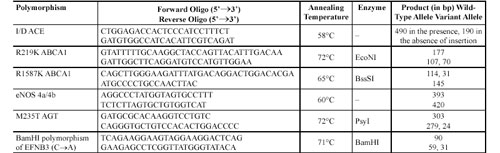
Genotyping. DNA was extracted by standard methods using proteinase K/phenol/chloroform treatment [39]. The polymorphism for each gene was determined by polymerase chain reaction (PCR) amplification and restriction enzyme cleavage. Genomic DNA (0.1 µg) was amplified in 20 µL of reaction mixture containing 5 pM of each primer, 1 mM of each dNTP, 2 µL of 10 × reaction buffer [500 mM Tris-HCl, pH 8.8, 150 mM (NH4)2SO4, 50 mM MgCl2, 2 mg/mL BSA, 0.1% Tween and 0.1% gelatin] and 0.5 units Taq DNA polymerase. After the DNA had been denatured for 5 min. at 95°C, the reaction mixture was subjected to 30 cycles of denaturation for 1 min. at 95°C, annealing for 1 min. and extension for 1 min. at 72°C. The polymorphism was detected by digestion of the PCR-amplified fragment with particular restriction enzymes, separation on 6% polyacrylamide gels and visualization of fragments with ethidium bromide staining. The forward and reverse primers, restriction enzymes and fragment size for each locus are shown
Statistical Analysis. Statistical analysis was performed using the software STATISTICA, version 6.0. The linkage between CAD and each of the genes studied was determined using the sibling transmission/disequilibrium test (S-TDT), which is employed to analyze the distribution of allele variants and clinical characteristics in proband-sibling pairs. In the case of tight linkage, the z-score is usually greater than 2.47 for biallelic markers [40]. Allele frequencies were derived by gene counting, and checks for deviation of single-locus genotypes from Hardy Weinberg equilibrium were based on Fishers exact test. Comparisons of allele and genotype frequencies in the different groups under study were assessed by Fishers exact test or by ÷2 test. Whenever significant genotype associations are reported, relative risks (RRs) and their 95% confidence intervals (95% CI) are provided. The RR was calculated as: RR = [A/(A+B)] / [C/(C+D)], where A and B are the numbers of patients with and without genetic markers, respectively, and C and D are the numbers of healthy subjects with and without genetic markers, respectively. Confidence intervals were calculated as: CI = exp (lnRR) ± t v[B/A]/(B+A) + [D/C]/(D+C).
Table 2. Forward and reverse primers, restriction enzymes and fragment size for each analyzed locus.
Correlations of physical and biochemical variables with different genotypes were determined by ã correlation analysis after correction of the primary data for sex, body mass index (BMI) and age. Comparisons of variables between groups with different single-locus genotypes were determined by contingency table analysis for categorical measures and by independent Students t tests for continuous traits. Data without a normal distribution were log transformed before analysis. Comparisons of means values in groups with different single-locus genotypes were performed using the Newman-Keuls test.
|
|
|
|

 |
Number 27
VOL. 27 (2), 2024 |
Number 27
VOL. 27 (1), 2024 |
Number 26
Number 26 VOL. 26(2), 2023 All in one |
Number 26
VOL. 26(2), 2023 |
Number 26
VOL. 26, 2023 Supplement |
Number 26
VOL. 26(1), 2023 |
Number 25
VOL. 25(2), 2022 |
Number 25
VOL. 25 (1), 2022 |
Number 24
VOL. 24(2), 2021 |
Number 24
VOL. 24(1), 2021 |
Number 23
VOL. 23(2), 2020 |
Number 22
VOL. 22(2), 2019 |
Number 22
VOL. 22(1), 2019 |
Number 22
VOL. 22, 2019 Supplement |
Number 21
VOL. 21(2), 2018 |
Number 21
VOL. 21 (1), 2018 |
Number 21
VOL. 21, 2018 Supplement |
Number 20
VOL. 20 (2), 2017 |
Number 20
VOL. 20 (1), 2017 |
Number 19
VOL. 19 (2), 2016 |
Number 19
VOL. 19 (1), 2016 |
Number 18
VOL. 18 (2), 2015 |
Number 18
VOL. 18 (1), 2015 |
Number 17
VOL. 17 (2), 2014 |
Number 17
VOL. 17 (1), 2014 |
Number 16
VOL. 16 (2), 2013 |
Number 16
VOL. 16 (1), 2013 |
Number 15
VOL. 15 (2), 2012 |
Number 15
VOL. 15, 2012 Supplement |
Number 15
Vol. 15 (1), 2012 |
Number 14
14 - Vol. 14 (2), 2011 |
Number 14
The 9th Balkan Congress of Medical Genetics |
Number 14
14 - Vol. 14 (1), 2011 |
Number 13
Vol. 13 (2), 2010 |
Number 13
Vol.13 (1), 2010 |
Number 12
Vol.12 (2), 2009 |
Number 12
Vol.12 (1), 2009 |
Number 11
Vol.11 (2),2008 |
Number 11
Vol.11 (1),2008 |
Number 10
Vol.10 (2), 2007 |
Number 10
10 (1),2007 |
Number 9
1&2, 2006 |
Number 9
3&4, 2006 |
Number 8
1&2, 2005 |
Number 8
3&4, 2004 |
Number 7
1&2, 2004 |
Number 6
3&4, 2003 |
Number 6
1&2, 2003 |
Number 5
3&4, 2002 |
Number 5
1&2, 2002 |
Number 4
Vol.3 (4), 2000 |
Number 4
Vol.2 (4), 1999 |
Number 4
Vol.1 (4), 1998 |
Number 4
3&4, 2001 |
Number 4
1&2, 2001 |
Number 3
Vol.3 (3), 2000 |
Number 3
Vol.2 (3), 1999 |
Number 3
Vol.1 (3), 1998 |
Number 2
Vol.3(2), 2000 |
Number 2
Vol.1 (2), 1998 |
Number 2
Vol.2 (2), 1999 |
Number 1
Vol.3 (1), 2000 |
Number 1
Vol.2 (1), 1999 |
Number 1
Vol.1 (1), 1998 |
|
|