

THERE IS NO ASSOCIATION BETWEEN THE 318 (C→T) AND +49 (A→G)
CTLA4 GENE POLYMORPHISMS AND THE COELIAC CONDITION
IN THE MALTESE POPULATION
Borg J1,*, Scerri CA1,3, Vidal C2, Xuereb Anastasi A1,2
*Corresponding Author: Joseph Borg, B.Sc (Hons) MLS, Laboratory of Molecular Genetics, Department of Physiology and Biochemistry, Biomedical Science Building, University of Malta, Msida, Malta; Tel.: +356-2340-2774, Fax: +356-2134-3535, E-mail: joseph.borg@biotech.um.edu.mt
page: 49
|
|
RESULTS
Demographic Data. Thirty-three (35.1%) of the coeliac individuals were diagnosed between the ages of 31 and 45, with 26 (27.1%) diagnosed at age 46 years and over. Nineteen (20.2%) patients were diagnosed at an age younger than 15, while 16 (17.0%) were diagnosed between 16 and 30 years of age. The mean age of diagnosis for all the patients was 34 years.
The average age at diagnosis for the male coeliac patients was 32 years, while for the female coeliac patients the average age at diagnosis was 34 years. An independent Students t-test, done between the age at diagnosis of males and females, showed no statistical significance (t = 0.65, p = 0.51), signifying that there is no difference in age at diagnosis between the two genders. Among the female population, the highest proportion (39%) were diagnosed between 31-45 years, with lower percentages [30% (46 or more), 17% (15 or less) and 14% (16-30)] for the other age groups. Among the male patients, the age distribution was approximately the same for all age groups. Twenty-six percent for age groups 15 or less, 16-30 years, 31-45 years, and 22% for the over 46 age group.
The CTLA4 318 (C→T) and +49 (A→G) Genotypes. The two polymorphisms were in Hardy-Weinberg equilibrium in both the neonatal control and coeliac population. The results are presented in Table 1. Possible association between the studied CTLA4 gene polymorphisms and CD was tested by comparing the relative frequencies of the different genotypes between the neonatal controls and the coeliac samples. Using the Pearson chi-square test, no statistical difference was observed between the genotypes of the CTLA4 318 (C→T) polymorphism among the neonatal controls and coeliac patients [χ2 = 1.20; degrees of freedom (df) = 1; p = 0.27]. The same test was used for the frequency of the CTLA4 +49 (A→G) genotypes among the neonatal controls and coeliac samples and showed no statistical difference (χ2 = 2.24; df = 1; p = 0.13). The Fishers exact test was employed to test for alleles of the neonatal controls with CD in both SNPs, but no statistically significant results were obtained for the 318 (C→T) (p = 0.54) and +49 (A→G) (p = 0.46) SNPs.
Linkage Disequilibrium Between the 318 (C→T) and +49 (A→G) Polymorphisms. Evidence of linkage disequilibrium between alleles C and A was observed in the control group (χ2 = 10.49; p = 0.02). Haplotype frequencies were constructed by the estimated haplotypes program (ftp:/linkage.rockefeller.edu/software/utilities). The distribution of haplotype frequencies among the coeliac patients and neonatal controls are shown in Table 2. No significant difference was observed between the two groups (χ2 = 0.04; p = 1.0).
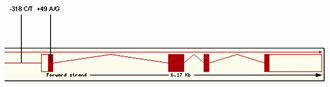
Figure 1. Schematic representation of the CTLA4 gene showing the two SNPs studied in this project.
Table 1. Genotype distribution of the 318 (C→T) and +49 (A→G) polymorphims in the control and coeliac population
|
SNP Genotype
318 (C→T) |
Neonatal
Controls |
Coeliac
Patients |
|
CC |
151 |
80 |
|
CT |
34 |
20 |
|
TT |
2 |
0 |
|
Hardy-Weinberg
equilibrium |
χ 2 = 0.003;
p = 0.96 |
χ 2 = 1.2;
p = 0.27 |
|
SNP Genotype
+49 (A→G) |
Neonatal
Controls |
Coeliac
Patients |
|
AA |
105 |
52 |
|
AG |
70 |
45 |
|
GG |
11 |
3 |
|
Hardy-Weinberg
equilibrium |
χ 2 = 0.02;
p = 0.88 |
χ 2 = 3.4;
p = 0.07 |
Table 2. The CTLA4 haplotype counts in coeliac patients and neonatal controls
|
Allele at Locus
|
Haplotype Count |
|
+49
(A→G) |
318
(C→T) |
Neonatal
Controls |
Coeliac
Patients |
|
A |
C |
121 |
67 |
|
A |
T |
19 |
7 |
|
G |
C |
47 |
23 |
|
G |
T |
|
3 |
|
Total |
|
187 |
100 |
|
|
|
|

 |
Number 28
Vol 28 2025 Supplement |
Number 27
VOL. 27 (2), 2024 |
Number 27
VOL. 27 (1), 2024 |
Number 26
Number 26 VOL. 26(2), 2023 All in one |
Number 26
VOL. 26(2), 2023 |
Number 26
VOL. 26, 2023 Supplement |
Number 26
VOL. 26(1), 2023 |
Number 25
VOL. 25(2), 2022 |
Number 25
VOL. 25 (1), 2022 |
Number 24
VOL. 24(2), 2021 |
Number 24
VOL. 24(1), 2021 |
Number 23
VOL. 23(2), 2020 |
Number 22
VOL. 22(2), 2019 |
Number 22
VOL. 22(1), 2019 |
Number 22
VOL. 22, 2019 Supplement |
Number 21
VOL. 21(2), 2018 |
Number 21
VOL. 21 (1), 2018 |
Number 21
VOL. 21, 2018 Supplement |
Number 20
VOL. 20 (2), 2017 |
Number 20
VOL. 20 (1), 2017 |
Number 19
VOL. 19 (2), 2016 |
Number 19
VOL. 19 (1), 2016 |
Number 18
VOL. 18 (2), 2015 |
Number 18
VOL. 18 (1), 2015 |
Number 17
VOL. 17 (2), 2014 |
Number 17
VOL. 17 (1), 2014 |
Number 16
VOL. 16 (2), 2013 |
Number 16
VOL. 16 (1), 2013 |
Number 15
VOL. 15 (2), 2012 |
Number 15
VOL. 15, 2012 Supplement |
Number 15
Vol. 15 (1), 2012 |
Number 14
14 - Vol. 14 (2), 2011 |
Number 14
The 9th Balkan Congress of Medical Genetics |
Number 14
14 - Vol. 14 (1), 2011 |
Number 13
Vol. 13 (2), 2010 |
Number 13
Vol.13 (1), 2010 |
Number 12
Vol.12 (2), 2009 |
Number 12
Vol.12 (1), 2009 |
Number 11
Vol.11 (2),2008 |
Number 11
Vol.11 (1),2008 |
Number 10
Vol.10 (2), 2007 |
Number 10
10 (1),2007 |
Number 9
1&2, 2006 |
Number 9
3&4, 2006 |
Number 8
1&2, 2005 |
Number 8
3&4, 2004 |
Number 7
1&2, 2004 |
Number 6
3&4, 2003 |
Number 6
1&2, 2003 |
Number 5
3&4, 2002 |
Number 5
1&2, 2002 |
Number 4
Vol.3 (4), 2000 |
Number 4
Vol.2 (4), 1999 |
Number 4
Vol.1 (4), 1998 |
Number 4
3&4, 2001 |
Number 4
1&2, 2001 |
Number 3
Vol.3 (3), 2000 |
Number 3
Vol.2 (3), 1999 |
Number 3
Vol.1 (3), 1998 |
Number 2
Vol.3(2), 2000 |
Number 2
Vol.1 (2), 1998 |
Number 2
Vol.2 (2), 1999 |
Number 1
Vol.3 (1), 2000 |
Number 1
Vol.2 (1), 1999 |
Number 1
Vol.1 (1), 1998 |
|
|
|