

THE ANALYSIS OF MICRONUCLEI FREQUENCY IN
A CONTROL SAMPLE, AND IN HORMONALLY-
TREATED FEMALE PATIENTS ATTENDING THE
KRAGUJEVAC HOSPITAL, SERBIA, YUGOSLAVIA
Milosevic-Djordjevic O1, Grujicic D1, Marinkovic D2, Arsenijevic S3,
Joksic G4, Jankovic S5
*Corresponding Author: Dr. Olivera Milosevic-Djordjevic, Faculty of Sciences, University of Kragujevac, Institute of Biology, Department of Genetics, Radoja Domanovica 12, P.O. Box 60, 34000 Kragujevac, Serbia, Yugoslavia; Tel: +381-34-336-223 to 330; Fax: +381-34-335-040; E-mail: darko@knez.uis.kg.ac.yu
page: 37
|
|
RESULTS AND DISCUSSION
The average frequencies of MN in samples from 29 patients, before and after the end of therapy, and who have been divided into four groups, depending on the type of applied therapy, are presented in Table 1. Gestormone, Progesterone depo and Gravibinone increased MN frequency when compared to average values before therapy, with probability p<0.05, while Utrogestane also increased the frequency, but without statistical significance (p<0.1).
The summarized results of ANOVA (Table 2) for MN frequency show that between group and within group variances, statistically significant difference exists (F = 8.63; p = 0.005). The variability in MN frequency could be attributed to the gestagen therapy, having in mind differences in dosage depending on their clinical state, and the possibility of differences in sensitivity to gestagens. Different life conditions, such as working and life environments, diet, former therapeutic treatment, and some habits, can influence the MN variability. For example, vegetarian diet and alcohol consumption can increase the MN frequency induced by smoking [11-13], while drinking tea tended to decrease MN frequency [13].
By analysis of variance, we have determined the participation of both genetic factors and gestagen therapy, in genesis of phenotypic variability. By comparison of variances of patients before and after gestagen therapy, we concluded that the influence of gestagen therapy (79.2%) on variability in MN frequency is greater than influences of genetic factors (20.8%).
The more detailed ANOVA results for MN frequency in investigated samples, in relation to type of applied therapy, are presented in Table 3. In all investigated groups, between group variance (S2BG) is greater in relation to within group variance (S2WG), and that is attributed to the influence of applied therapy. By comparison of between group and within group variance, a statistically significant difference was found in the therapy with Progesterone depo (p = 0.006), while this was not the case in the other therapies, and that can be explained by the relatively small number of persons to whom the therapy was applied (Table 4). The greatest within group variance (S2WG) was observed in therapy by Progesterone depo preparations, which can be explained by the individual sensitivity of female patients on the prescribed therapy.
The smallest between and within group variance in MN frequency was observed in patients who has received Gestormone (S2BG = 60.5; S2WG = 11.8) and Gravibinone (S2BG = 62.5; S2WG = 23.1), that can be explained by the lowest applied average doses of therapy.
We conclude that therapy with Gestormone, Progesterone depo, Gravibinone and Utrogestane, that has been applied in the first 3 months of pregnancy, significantly increases the frequency and variability of MN in peripheral blood lymphocytes of the studied female patients.
Table 1. Frequencies of micronuclei in peripheral blood lymphocytes of 29 pregnant women, before and after therapy with Gestormone (#1-#4), Progesterone depo (#5-#21), Gravibinone (#22-#26), and Utrogestane (#27-#29)
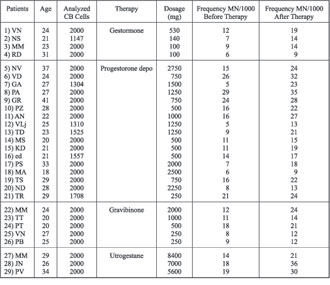
Table 2. Average frequencies of micronuclei in relation to type and dose of applied gestagens in the first 3 months of pregnancy (X±SE)
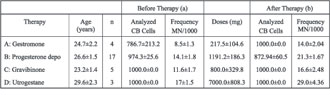
tA(a,b )= 5.74 tB(a,b) = 7.44 tC(a,b) = 2.84 tD(a,b) = 3.73
df = 3 df = 16 df = 4 df = 2
p<0.05 p<0.05 p<0.05 p<0.1
Table 3. Analysis of variance (ANOVA) of micronuclei frequency in analyzed samples
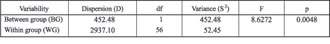
Vg = 20.8% Ve = 79.18%
Table 4. ANOVA for micronuclei frequency in investigated samples in relation to type of therapy
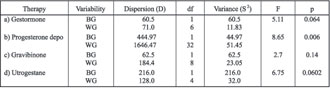
BG = between group; WG = within group.
|
|
|
|

 |
Number 28
Vol 28 2025 Supplement |
Number 27
VOL. 27 (2), 2024 |
Number 27
VOL. 27 (1), 2024 |
Number 26
Number 26 VOL. 26(2), 2023 All in one |
Number 26
VOL. 26(2), 2023 |
Number 26
VOL. 26, 2023 Supplement |
Number 26
VOL. 26(1), 2023 |
Number 25
VOL. 25(2), 2022 |
Number 25
VOL. 25 (1), 2022 |
Number 24
VOL. 24(2), 2021 |
Number 24
VOL. 24(1), 2021 |
Number 23
VOL. 23(2), 2020 |
Number 22
VOL. 22(2), 2019 |
Number 22
VOL. 22(1), 2019 |
Number 22
VOL. 22, 2019 Supplement |
Number 21
VOL. 21(2), 2018 |
Number 21
VOL. 21 (1), 2018 |
Number 21
VOL. 21, 2018 Supplement |
Number 20
VOL. 20 (2), 2017 |
Number 20
VOL. 20 (1), 2017 |
Number 19
VOL. 19 (2), 2016 |
Number 19
VOL. 19 (1), 2016 |
Number 18
VOL. 18 (2), 2015 |
Number 18
VOL. 18 (1), 2015 |
Number 17
VOL. 17 (2), 2014 |
Number 17
VOL. 17 (1), 2014 |
Number 16
VOL. 16 (2), 2013 |
Number 16
VOL. 16 (1), 2013 |
Number 15
VOL. 15 (2), 2012 |
Number 15
VOL. 15, 2012 Supplement |
Number 15
Vol. 15 (1), 2012 |
Number 14
14 - Vol. 14 (2), 2011 |
Number 14
The 9th Balkan Congress of Medical Genetics |
Number 14
14 - Vol. 14 (1), 2011 |
Number 13
Vol. 13 (2), 2010 |
Number 13
Vol.13 (1), 2010 |
Number 12
Vol.12 (2), 2009 |
Number 12
Vol.12 (1), 2009 |
Number 11
Vol.11 (2),2008 |
Number 11
Vol.11 (1),2008 |
Number 10
Vol.10 (2), 2007 |
Number 10
10 (1),2007 |
Number 9
1&2, 2006 |
Number 9
3&4, 2006 |
Number 8
1&2, 2005 |
Number 8
3&4, 2004 |
Number 7
1&2, 2004 |
Number 6
3&4, 2003 |
Number 6
1&2, 2003 |
Number 5
3&4, 2002 |
Number 5
1&2, 2002 |
Number 4
Vol.3 (4), 2000 |
Number 4
Vol.2 (4), 1999 |
Number 4
Vol.1 (4), 1998 |
Number 4
3&4, 2001 |
Number 4
1&2, 2001 |
Number 3
Vol.3 (3), 2000 |
Number 3
Vol.2 (3), 1999 |
Number 3
Vol.1 (3), 1998 |
Number 2
Vol.3(2), 2000 |
Number 2
Vol.1 (2), 1998 |
Number 2
Vol.2 (2), 1999 |
Number 1
Vol.3 (1), 2000 |
Number 1
Vol.2 (1), 1999 |
Number 1
Vol.1 (1), 1998 |
|
|
|