

APOLIPOPROTEIN(a) POLYMORPHISMS IN A HEALTHY MACEDONIAN POPULATION
Tosheska K*, Labudovic D, Alabakovska S, Todorova B
*Corresponding Author: Katerina Tosheska K, MD, MSc., Department of Medical and Experimental Biochemistry, Faculty of Medicine, 50 Divizija 6, 1000 Skopje, Republic of Macedonia; Tel: +389-2-3217-303; Fax: +389-2-3230-431; E-mail: tosheskatrajkovska@yahoo.com
page: 49
|
|
RESULTS
Five apo(a) isoforms (B, S1, S3, S4 and >S4) were resolvable by the SDS-PAGE system followed by immunoblotting with a sheep polyclonal anti-human apo(a) antibody. In each plasma, one of these five bands was generally present, either alone (single-banded phenotype) or in combination with another band (double-banded phenotype). The phenotype was defined as null when there were no detectable apo(a) bands.
The frequency of apo(a) phenotypes in the test subjects is shown in Table 1. One hundred and seven (59.44%) had single-banded phenotypes and 64 (35.56%) had double-banded phenotypes. Nine individuals (5%) had the null phenotype. There was no significant difference in the apo(a) isoform frequency distribution between gender groups (P2 = 0.514, p = 0.77).
All five of the possible single-banded phenotypes and eight of the 12 possible double-banded phenotypes were detected. The frequencies of single-banded and double-banded phenotypes are given in Table 2. Among the single-banded phenotypes, S4 was the most frequent (49.14%) and S1 and B were comparatively rare (1.72%). The S4/S3 phenotype was the most frequent (43.75%) among the double-banded phenotypes.
Based upon the hypothesis that the apo(a) polymorphism is controlled by different alleles at a single locus, the frequencies of the six alleles were: LpB = 0.022, LpS1 = 0.028, LpS3 = 0.201, LpS4 = 0.397, Lp>S4 =0.110, and LpO = 242. Comparison of the observed phenotype frequencies with those expected from the genetic hypothesis, and assuming that the Hardy-Weinberg equilibrium showed no significant difference [P2 =17.21, degrees of freedom (df) = 15, p <0.3067) (Table 2).
As shown in Figure 1, the distribution of Lp(a) concentration is highly skewed towards lower concentrations with most of the subjects, 164 (91.1%) having an Lp(a) level beneath the cut-off point of 30 mg/dL. The plasma level of Lp(a) in males and females is presented in Table 3. There was no significant difference in plasma Lp(a) levels between the sexes (two-sample unpaired Students t-test, p = 0.4246). The Mr of apo(a) isoforms and Lp(a) concentrations are presented in Table 4. We confirmed that low Mr isoforms (B, S1) are associated with elevated Lp(a) concentrations, whereas the high Mr isoforms (S4 and S3) are associated with lower Lp(a) levels. We found a significant inverse correlation [Pearsons correlation coefficient (r) = 0.3477, p <0.001) between the Mr of apo(a) isoforms and plasma levels of Lp(a) (Fig. 2).
Table 1. Frequency of apo(a) phenotypes in 180 Macedonian blood donors
Isoform |
Males |
Females |
Total |
|
n |
% |
n |
% |
n |
% |
Single |
58 |
61.10 |
49 |
56.98 |
107 |
59.44 |
Double |
32 |
|
Table 2. Frequency of observed and expected phenotypes in 180 Macedonian blood donors
Isoform |
Observed Apo(a) Isoform |
Expected Apo(a) Isoform |
Single |
n |
% |
n |
% |
>S4 |
14 |
12.07 |
11,767 |
10.27 |
S4 |
57 |
49.14 |
62,804 |
54.81 |
S3 |
32 |
27.59 |
24,810 |
21.65 |
S1 |
2 |
1.72 |
2591 |
2.26 |
B |
2 |
1.72 |
2,050 |
1.79 |
Null |
9 |
7.76 |
10,565 |
9.22 |
Total |
116 |
100.00 |
114,597 |
100.00 |
Double |
n |
% |
n |
% |
>S4/S4 |
22 |
34.38 |
15,683 |
23.92 |
>S4/S3 |
1 |
1.56 |
7,959 |
12.14 |
>S4/S1 |
0 |
0.00 |
1,112 |
1.70 |
S4/S3 |
28 |
43.75 |
28,673 |
43.75 |
S4/S1 |
6 |
9.38 |
4,005 |
6.11 |
>S4/B |
0 |
0.00 |
889 |
1.36 |
S4/B |
4 |
6.25 |
3,204 |
4.89 |
S3/S1 |
1 |
1.56 |
2,032 |
3.10 |
S3/B |
1 |
1.56 |
1,626 |
2.48 |
S1/B |
1 |
1.56 |
352 |
0.54 |
Total |
64 |
100.00 |
65,535 |
100.00 |
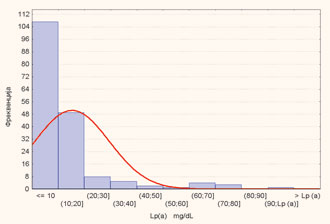
Figure 1. Frequency distribution of Lp(a) concentration
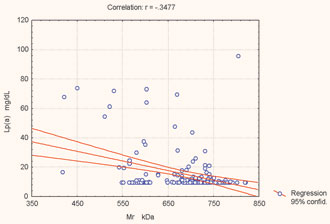
Figure 2. Correlation between Mr of apo(a) isoforms and Lp(a) concentration.
|
|
|
|

 |
Number 28
Vol 28 2025 Supplement |
Number 27
VOL. 27 (2), 2024 |
Number 27
VOL. 27 (1), 2024 |
Number 26
Number 26 VOL. 26(2), 2023 All in one |
Number 26
VOL. 26(2), 2023 |
Number 26
VOL. 26, 2023 Supplement |
Number 26
VOL. 26(1), 2023 |
Number 25
VOL. 25(2), 2022 |
Number 25
VOL. 25 (1), 2022 |
Number 24
VOL. 24(2), 2021 |
Number 24
VOL. 24(1), 2021 |
Number 23
VOL. 23(2), 2020 |
Number 22
VOL. 22(2), 2019 |
Number 22
VOL. 22(1), 2019 |
Number 22
VOL. 22, 2019 Supplement |
Number 21
VOL. 21(2), 2018 |
Number 21
VOL. 21 (1), 2018 |
Number 21
VOL. 21, 2018 Supplement |
Number 20
VOL. 20 (2), 2017 |
Number 20
VOL. 20 (1), 2017 |
Number 19
VOL. 19 (2), 2016 |
Number 19
VOL. 19 (1), 2016 |
Number 18
VOL. 18 (2), 2015 |
Number 18
VOL. 18 (1), 2015 |
Number 17
VOL. 17 (2), 2014 |
Number 17
VOL. 17 (1), 2014 |
Number 16
VOL. 16 (2), 2013 |
Number 16
VOL. 16 (1), 2013 |
Number 15
VOL. 15 (2), 2012 |
Number 15
VOL. 15, 2012 Supplement |
Number 15
Vol. 15 (1), 2012 |
Number 14
14 - Vol. 14 (2), 2011 |
Number 14
The 9th Balkan Congress of Medical Genetics |
Number 14
14 - Vol. 14 (1), 2011 |
Number 13
Vol. 13 (2), 2010 |
Number 13
Vol.13 (1), 2010 |
Number 12
Vol.12 (2), 2009 |
Number 12
Vol.12 (1), 2009 |
Number 11
Vol.11 (2),2008 |
Number 11
Vol.11 (1),2008 |
Number 10
Vol.10 (2), 2007 |
Number 10
10 (1),2007 |
Number 9
1&2, 2006 |
Number 9
3&4, 2006 |
Number 8
1&2, 2005 |
Number 8
3&4, 2004 |
Number 7
1&2, 2004 |
Number 6
3&4, 2003 |
Number 6
1&2, 2003 |
Number 5
3&4, 2002 |
Number 5
1&2, 2002 |
Number 4
Vol.3 (4), 2000 |
Number 4
Vol.2 (4), 1999 |
Number 4
Vol.1 (4), 1998 |
Number 4
3&4, 2001 |
Number 4
1&2, 2001 |
Number 3
Vol.3 (3), 2000 |
Number 3
Vol.2 (3), 1999 |
Number 3
Vol.1 (3), 1998 |
Number 2
Vol.3(2), 2000 |
Number 2
Vol.1 (2), 1998 |
Number 2
Vol.2 (2), 1999 |
Number 1
Vol.3 (1), 2000 |
Number 1
Vol.2 (1), 1999 |
Number 1
Vol.1 (1), 1998 |
|
|
|